
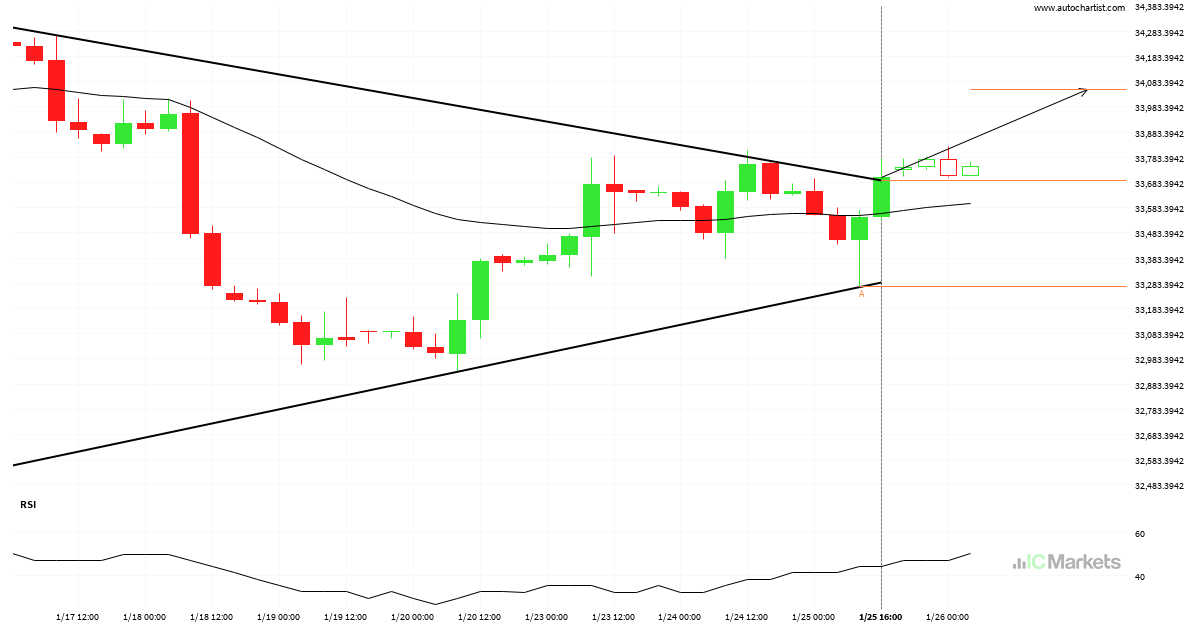
El US Wall Street 30 Index ha atravesado la resistencia
El US Wall Street 30 Index atravesó una línea de resistencia. Ha entrado en contacto con esta línea por lo menos dos veces en 16 días. Esta ruptura puede indicar un movimiento potencial a 34050.9112 en 2 días. Como ya vimos un retroceso de esta posición en el pasado, debemos esperar la confirmación de la […]
Posible ruptura del nivel de soporte en el Tesla Inc.
El Tesla Inc. avanza hacia la línea de soporte de un Canal alcista, que ya ha probado varias veces en el pasado. Hemos visto un retroceso antes desde esta línea, así que en esta etapa no está claro si atravesará esta línea o se recuperará como lo ha hecho anteriormente. Si el Tesla Inc. continúa […]
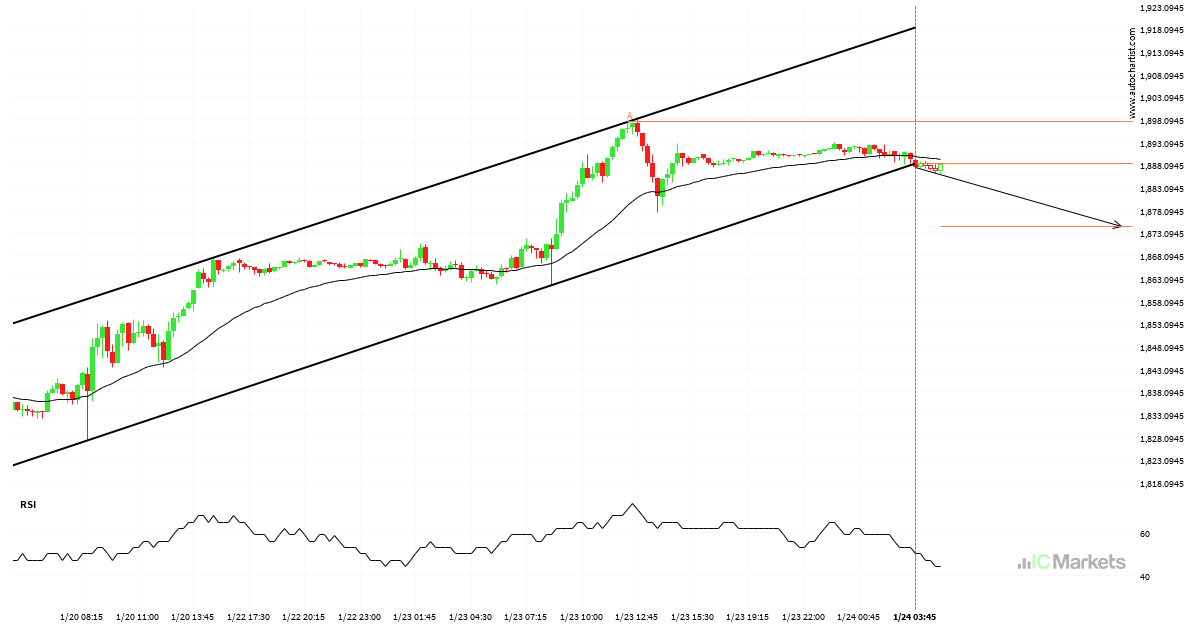
La línea de soporte ha sido irrumpida por el US Small Cap 2000 Index
El US Small Cap 2000 Index ha atravesado la línea de soporte, que ya se ha probado dos veces en el pasado. Hemos visto, anteriormente, un retroceso desde esta posición, así que debemos esperar la confirmación de la ruptura antes de operar. Si esta nueva tendencia persiste, un nivel objetivo alrededor de 1874.4553 podría materializarse […]
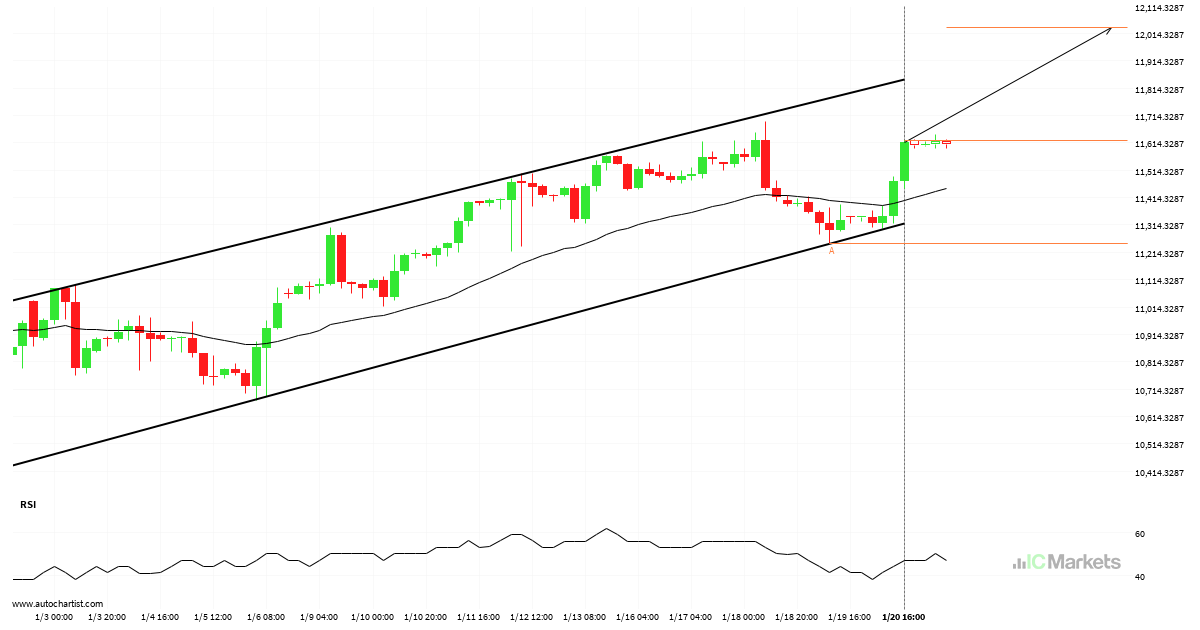
US Tech 100 Index – acercándose a la resistencia del Canal alcista
El US Tech 100 Index avanza hacia una línea de resistencia. Como le hemos visto retroceder desde esta línea anteriormente, podríamos presenciar, o bien, una ruptura a través de esta línea o una recuperación a los niveles actuales. Ha llegado a esta línea en numerosas ocasiones en los últimos 24 días y puede probarla de […]
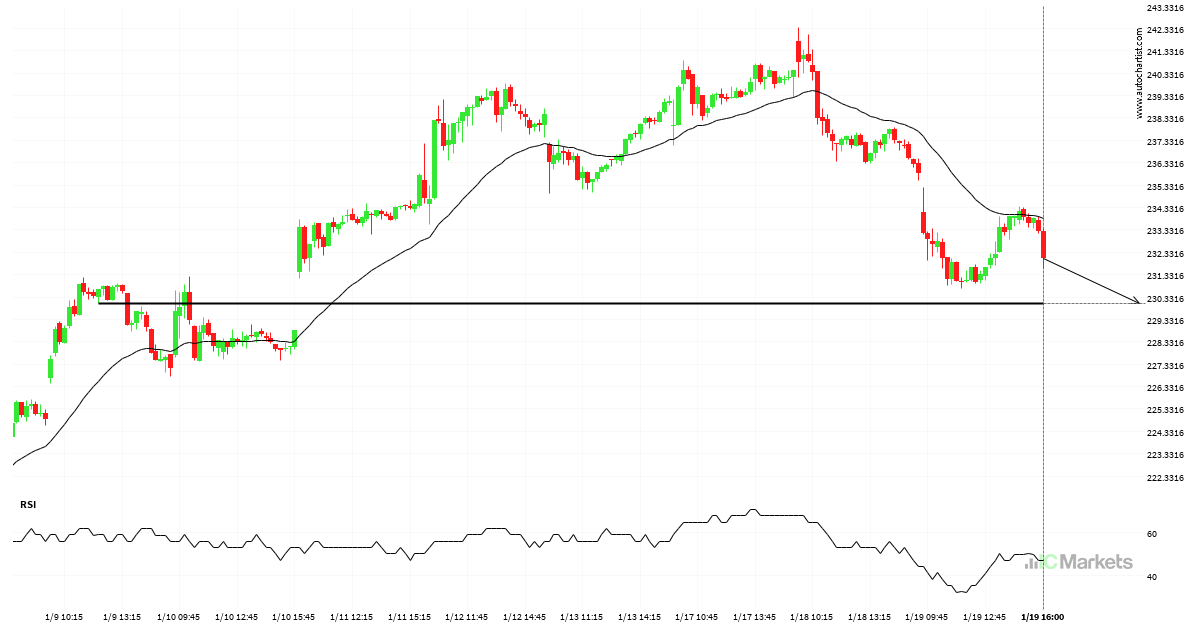
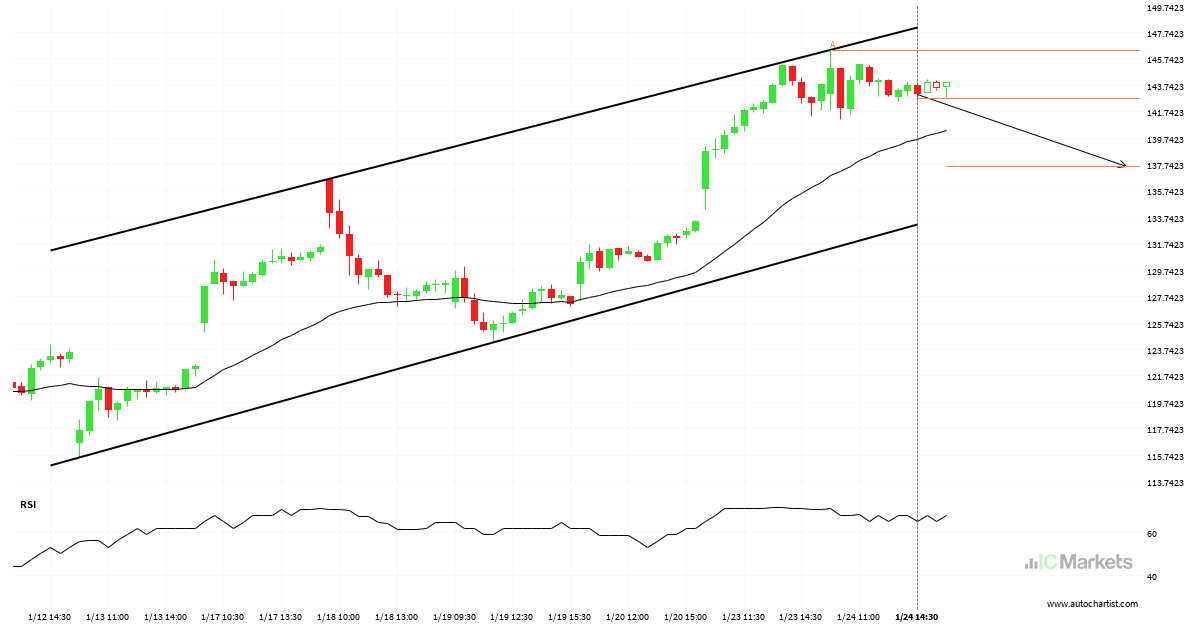
O bien, una inminente recuperación o una ruptura del Microsoft Corporation
El Microsoft Corporation avanza hacia la línea de 230.0300. Si este movimiento se mantiene, el precio del Microsoft Corporation podría probar el nivel de 230.0300 en un plazo de 12 horas. Pero no se apresure a la hora de operar, porque el par ha probado esta línea en numerosas ocasiones durante el pasado, por lo […]
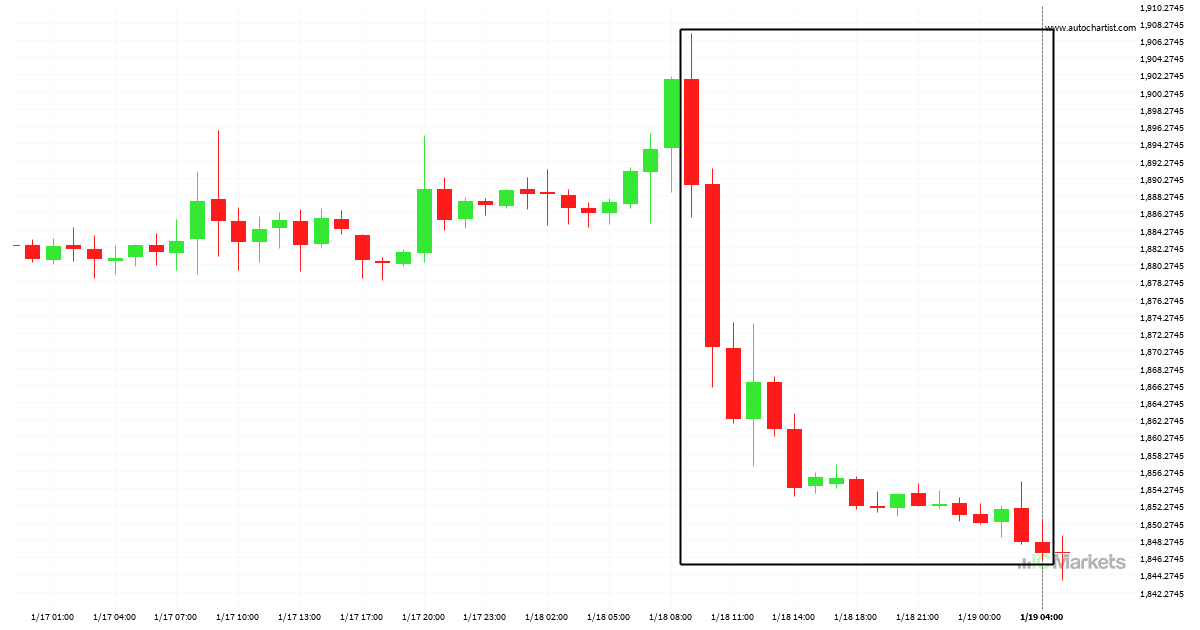
El US Small Cap 2000 Index está en dirección down
El US Small Cap 2000 Index ha experimentado un excepcional movimiento descendente de un 2,26% de 1889.5 a 1846.76 en 19 horas.
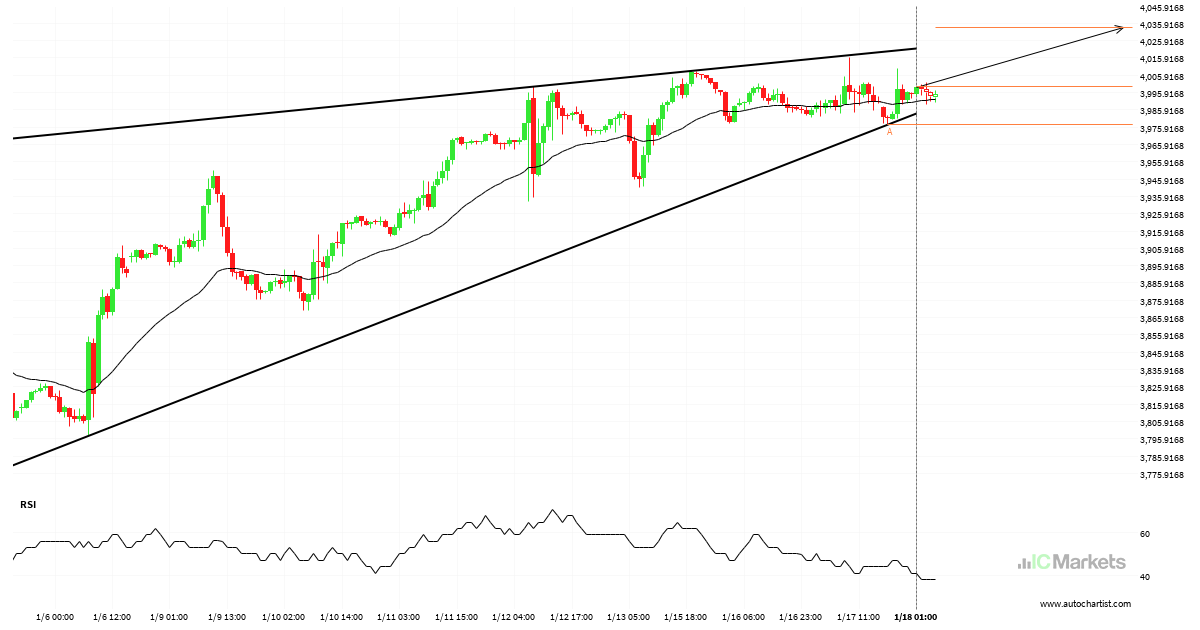
Posible ruptura del nivel de resistencia en el US SPX 500 Index
El US SPX 500 Index avanza hacia la línea de resistencia de un Cuña ascendente, que ya ha probado varias veces en el pasado. Hemos visto un retroceso antes desde esta línea, así que en esta etapa no está claro si atravesará esta línea o se recuperará como lo ha hecho anteriormente. Si el US […]
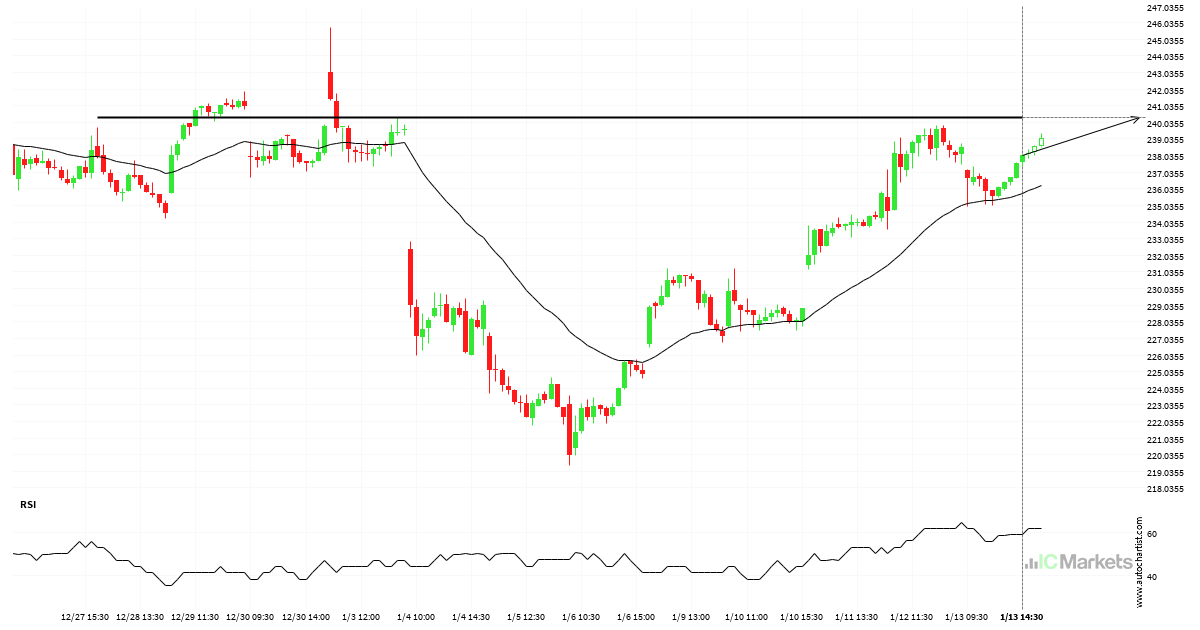
Un posible impulso final en el Microsoft Corporation
El Microsoft Corporation avanza hacia 240.3550 y podría alcanzar este punto en un plazo de 17 horas. Ha probado esta línea previamente en numerosas ocasiones y esta vez no tiene porqué ser diferente, terminando con una recuperación en lugar de en una rotura. Si la rotura no ocurre, podríamos observar un retroceso de nuevo a […]

Posible ruptura del nivel de resistencia en el US SPX 500 Index
El US SPX 500 Index avanza hacia la línea de resistencia de un Canal alcista, que ya ha probado varias veces en el pasado. Hemos visto un retroceso antes desde esta línea, así que en esta etapa no está claro si atravesará esta línea o se recuperará como lo ha hecho anteriormente. Si el US […]
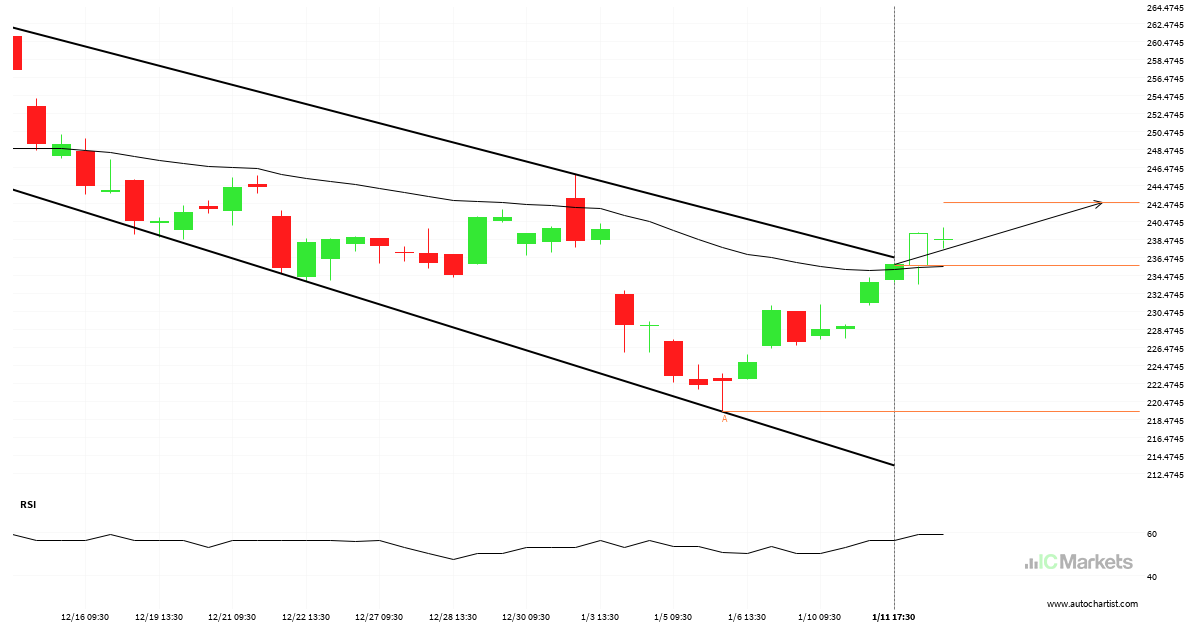
Se espera la posibilidad de un gran movimiento en el Microsoft Corporation
El Microsoft Corporation ha atravesado una línea de resistencia de un Canal bajista y sugiere un movimiento posible a 242.6581 dentro de las próximas 19 horas. Ya ha probado esta línea en el pasado, por lo que deberíamos esperar la confirmación de esta irrupción antes de entrar en acción. Si dicha ruptura no se confirma, […]